Measuring NPS
How is it valuable to the race owner?
Every race director and race owner I know cares deeply about runner experience. For many, the runner experience intersects with the reason they started operating races in the first place. It takes countless hours, meticulous detail and great leadership to produce a running event that delivers a great runner experience. And the race directors I know strive for improvement every single year.
But how do we know that what we’re doing is working?
Obviously growth in participation is an indicator of success, but there could be many reasons for that growth – growth in the market as a whole, an event anniversary year, a new partner, higher ad spend, and many others. Without also measuring the customer experience, it’s hard to accurately predict whether or not that growth will be sustained.
We measure a number of customer experience metrics, but I want to highlight one that we’ve found to be really valuable: Net Promoter Score (NPS).
Sidebar - The Importance of Also Measuring ‘Satisfaction’ Scores

We also measure event satisfaction metrics. We use a 1-5 scale and ask runners to rate their satisfaction with various elements of the event experience (e.g., expo, medal, course, post race party, etc.). We believe these metrics are incredibly important as they measure results compared to expectations.
Let me give you an example. A well known, long standing marathon in a major city may promise large numbers of runners and spectators, which is one thing that makes the event so special. But there are also probably long lines. My guess is that, overall, people don’t complain too much about the lines – they expect them. However, if there is a 20 minute line at gear check for a 200 person race, that would be a major issue.
Satisfaction measures how well you fulfilled your customers expectations. Expectations might change race to race, but how a race delivers against expectations is really important.
NPS Methodology
NPS is different. It measures how likely someone is to recommend your event.
The question used to measure NPS is always the same: “How likely is it that you would recommend INSERT YOUR RACE NAME to a friend or colleague?”
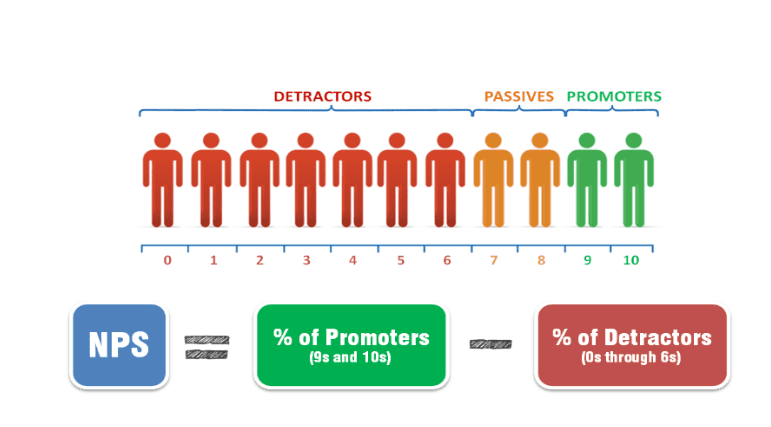
Then, people select their likelihood on a scale of 0 – 10. Once scores are collected, use this equation to calculate your NPS score.

Indeed, you IGNORE the “passives”…anyone who selected a 7 or 8.
Creators of NPS, Bain & Company, provide a little guidance for measuring yourself against others:
- Above 0 is Good
- Above 20 is Favorable
- Above 50 is Excellent
- Above 80 is World Class
The Value of NPS
NPS is valuable for a few key reasons in my opinion:
- It is very simple to measure.
- It can be easily benchmarked.
- It goes beyond ‘satisfaction’ and focuses on loyalty and advocacy. People can be satisfied with an experience in comparison to their expectations, but that doesn’t mean they will advocate the experience.
- It has proven predictive value. High NPS scores are associated with increased customer retention, and low scores can signal a future loss of customers.
Qualifying your NPS Score
Internally, we’ve tracked NPS scores for 6 years across all of our events. So, for us, our scores have become really valuable as an internal benchmark. We can compare the same race over multiple years, and we can also compare events across our portfolio to see how they compare. There could be differences based on things such as the event distance or the location, but we might also find best practices that we can replicate across events.
We’ve had events that started at a 19 and are now achieving NPS scores of nearly 70. Our average score over the last year is just over 60. We aren’t always able to improve them for each race each year, but that is our objective.
It would also be valuable to see benchmarks that encompass events in various categories across our entire industry. How do our events compare to running events nationally? In our region? Of a similar size? I haven’t been able to find these benchmarks.
We have found benchmarks from other industries. Some industries may be too different to offer fair comparisons. For example, I’d put my money on the fact that running events would have higher NPS scores than cable TV providers. But, in aggregate, even benchmarks from other industries allow us to put some context around our NPS scores.

Conclusion
If you aren’t already measuring NPS, I encourage you to start. If nothing else, you’ll develop your own internal benchmarks. You can add the NPS survey question to your post race runner survey, but be sure to include the question and answer options exactly as written above.
And perhaps we can work together to find an appropriate way to combine our information and create industry benchmarks for this and other metrics – it seems like it would help all of us focus on continuing to advance the experience of our runners.
If you’d like to discuss this or just share event war stories, best practices and challenges, feel free to reach out to me at charlie@capstoneraces.com.
